Financial and Operational Highlights
| 2013 | 2012 | ||
| Performance for the year ended 31 March | |||
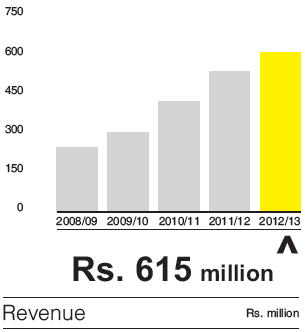
| Revenue | Rs. '000 | 614,727 | 539,192 |
| Earnings Before Interest, Tax, Depreciation & Amortization (EBITDA) |
Rs. '000 | 174,097 | 164,784 |
| Profit Before Tax (PBT) | Rs. '000 | 127,292 | 123,964 |
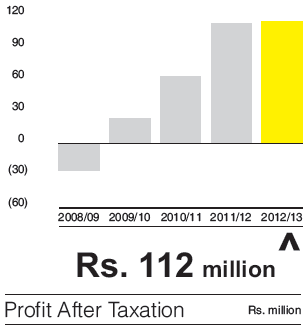
| Profit After Tax (PAT) | Rs. '000 | 112,154 | 111,097 |
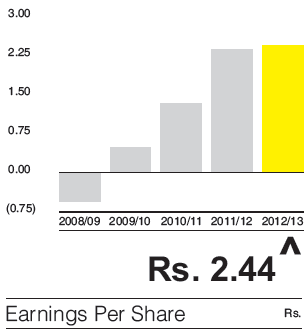
| Earnings Per Share (EPS) | Rs. | 2.44 | 2.42 |
| EPS Growth | % | 1 | 81 |
| Return on Equity | % | 5 | 5 |
| Financial Position as at 31 March | |||
| Total Assets | Rs. '000 | 2,509,784 | 2,478,895 |
| Total Debt | Rs. '000 | – | – |
| Total Equity | Rs. '000 | 2,403,531 | 2,371,629 |
| Number of Shares in Issue | No. 000s | 46,000 | 46,000 |
| Net Assets Per Share | Rs. | 52.25 | 51.56 |
| Debt/Equity | – | – | |
| Debt/Total Assets | – | – | |
| Current Ratio | 2.65:1 | 3.02:1 | |
| Quick Asset Ratio | 2.40:1 | 2.84:1 | |
| Market/Shareholder Information | |||
| Market Price Per Share as at 31 March | Rs | 47.40 | 50.00 |
| Market Capitalisation | Rs '000 | 2,180,400 | 2,300,000 |
| Price Earnings Ratio | Times | 19.43 | 20.66 |
| Dividend Payout | % | 82 | 83 |
| Dividend Proposed | Rs '000 | 92,000 | 92,000 |
| Dividend Per Share | Rs | 2.00 | 2.00 |
| Value Added for the year ended 31 March | |||
| To Government | Rs '000 | 15,138 | 12,866 |
| To Employees | Rs '000 | 98,145 | 85,428 |
| To Shareholders | Rs '000 | 92,000 | 92,000 |
 |
 |
 |
 |
